

Image Details
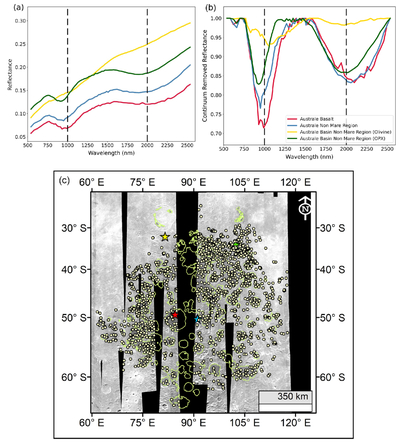
Caption: Figure 2.
Representative reflectance spectra and spectra collection points from the Australe region. (a) and (b) Reflectance spectra and the corresponding continuum-removed reflectance of olivine, opx, basalt, and nonmare region from the Australe region. (c) The M3mosaic of the study region depicting the available M3 strips. The light-yellow circles mark the location of the points from where spectra are extracted. The light green polygons represent the mare boundaries from D. M. Nelson et al. (2014). The yellow, green, red, and blue stars mark the location of the olivine, opx, basalt, and nonmare region, respectively, represented in (a) and (b).
Other Images in This Article
Copyright and Terms & Conditions
© 2026. The Author(s). Published by the American Astronomical Society.

