

Image Details
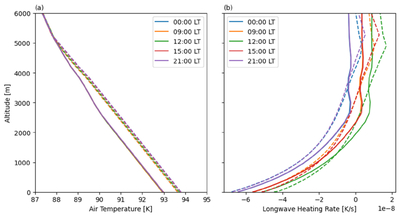
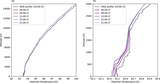
Caption: Figure A4.
Comparison of the vertical profile of the (a) air temperature and (b) longwave heating rate [K s−1] at various local times between the baseline (solid line) and damped sensible heat flux (dashed lines) simulations. Negative values indicate radiative cooling.
Other Images in This Article
Show More
Copyright and Terms & Conditions
© 2026. The Author(s). Published by the American Astronomical Society.

Copyright ©
2026 Astronomy Image Explorer. All Rights Reserved.
