

Image Details
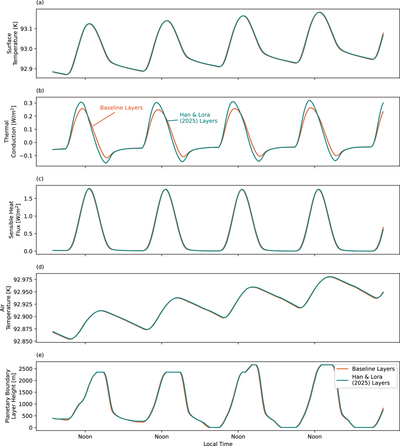
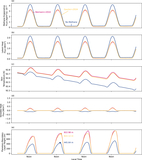
Caption: Figure A1.
Comparison of surface energy and PBL depth for simulations with two different subsurface layer structures but all other parameters equal (e.g., initial surface temperature, deep subsurface temperature, thermal conductivity, volumetric heat capacity). The baseline layer structure is shown in Table 1. The S. Han & J. M. Lora (2025) layer structure is shown in Table A1.
Other Images in This Article
Show More
Copyright and Terms & Conditions
© 2026. The Author(s). Published by the American Astronomical Society.

Copyright ©
2026 Astronomy Image Explorer. All Rights Reserved.
