Image Details
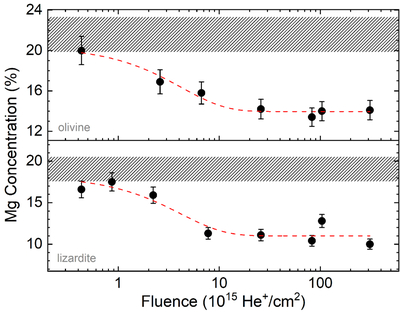
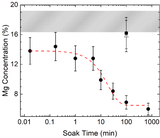
Caption: Figure 7.
Mg concentration in olivine (top) and lizardite (bottom) samples as a function of irradiation fluence and subsequent soaking. We soaked all samples in HPLC H2O for 5 minutes. The black circles represent the Mg concentration after soaking, while the shaded bar represents the range of measured Mg concentrations before and after irradiation. We have included a fitted curve (red dotted line) to guide the eye. Each black circle reflects the average final Mg concentration from all repeated experiments. Error bars reflect the largest standard error calculated in repeated experiments.
Other Images in This Article
Copyright and Terms & Conditions
© 2026. The Author(s). Published by the American Astronomical Society.
Copyright ©
2026 Astronomy Image Explorer. All Rights Reserved.