Image Details
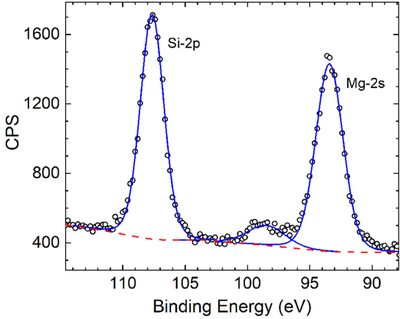
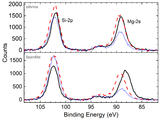
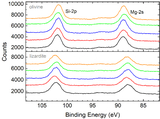
Caption: Figure 3.
Representative Shirley background subtraction and peak fitting done via CASA XPS on lizardite. Open circles represent recorded data, and the red dotted line represents the Shirley background. After the background subtraction, we used Gaussian fits to calculate the band areas for the Si 2p and Mg 2s features (blue solid lines). While we fit the Si 2p area with one Gaussian fit, the Mg 2s area always included a smaller shake-up peak at higher binding energy.
Other Images in This Article
Copyright and Terms & Conditions
© 2026. The Author(s). Published by the American Astronomical Society.
Copyright ©
2026 Astronomy Image Explorer. All Rights Reserved.