

Image Details
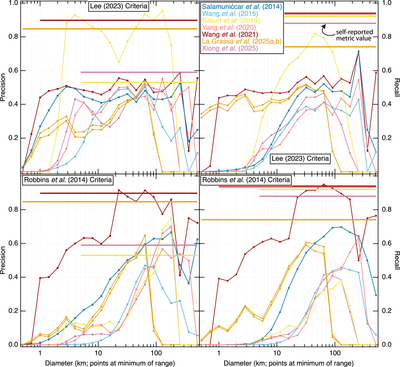
Caption: Figure 6.
Diameter-resolved comparison of precision (left) and recall (right) metrics for the different global databases under the three different matching constraints (top row C. Lee 2023, bottom row S. J. Robbins et al. 2014). Thinner horizontal lines indicate the stated precision or recall values in the paper describing that work, if present. Bins are 21/2D intervals with the minimum diameter as the placement for the point, where the third bin from the left in each graph is 1.0–1.4 km. To read this, for example, one could look at the bottom-left plot and see the horizontal line for R. La Grassa et al. (2025a) at 0.848 (the average of the range reported). It extends past the left axis and through the upper 512 km bound, indicating the range over which the authors stated completeness, or we inferred their intended completeness. One could then look at the same orange lines with square symbols lower on the plot to see our diameter-resolved calculation of their precision under the strict S. J. Robbins et al. (2014) criteria (location tolerance 5%, diameter tolerance 10%). One can see their peak precision is ≈0.55 for ∼60–80 km craters, but there is also a local minimum near ∼0.25 for ∼6–8 km craters. That indicates their self-reported metrics are larger than we derive under this strict matching, and because this graph is of precision, that means of all of the candidate craters identified, only ∼10% of ∼6–8 km craters are in R19.
Other Images in This Article
Copyright and Terms & Conditions
© 2026. The Author(s). Published by the American Astronomical Society.

