

Image Details
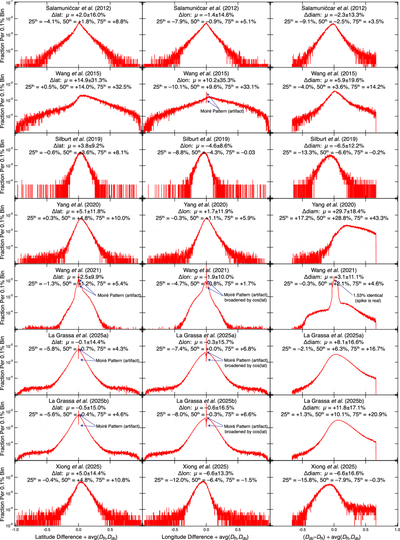
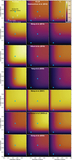
Caption: Figure 5.
Matrix of comparisons between latitude (left), longitude (middle), and diameter between the AI-based database and the reference database. Location is calculated in kilometers and so is a dimensionless unit when divided by avg(DR, Ddb). Values >0 are where the AI-based database has a larger value. Values for diameter do not span the full ±1.0 range (100% difference, e.g., matching a 5 km crater to a 10 km crater) because the matching parameter’s divisor is min(DR, Ddb), while the denominator to compare the data for these graphs is avg(DR, Ddb). The listed means and standard deviations were calculated assuming Gaussian moments, despite nonzero skew and non-Gaussian distributions, so medians and interquartile values are also given. Most of the spikes at ±0 for latitude and longitude have an under-filled bin adjacent, indicating the over/under is an artifact of rounding and aliasing, effectively a Moiré pattern. To interpret these numbers, the first number is the bias relative to R19, while the second number is the 1σ variation.
Other Images in This Article
Copyright and Terms & Conditions
© 2026. The Author(s). Published by the American Astronomical Society.

