

Image Details
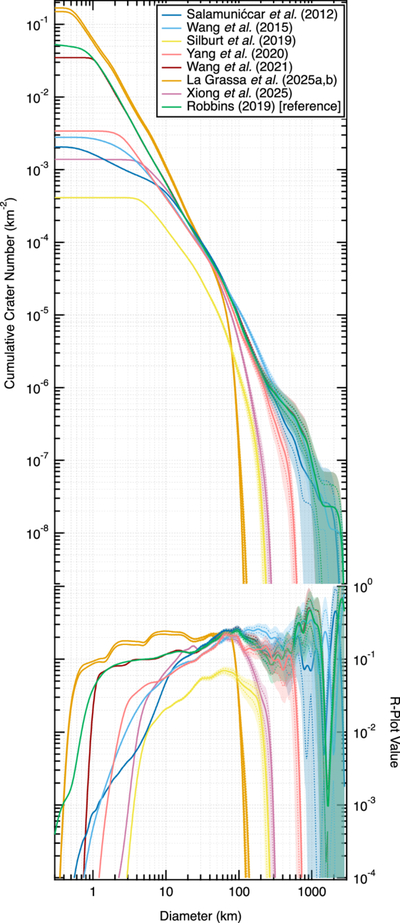
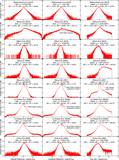
Caption: Figure 4.
Crater cumulative size-frequency distributions (SFDs) and relative or “R” SFDs for each database studied in this work, including the reference. They are overplotted here with 2σ confidence envelopes overlaid and 1σ confidence as dashed lines. These were produced using the empirical distribution method detailed in S. J. Robbins et al. (2018), which represents each crater as a Gaussian distribution, with the measured diameter as the mean, and the uncertainty as 0.1·D based on the S. J. Robbins et al. (2014) repeatability study’s crater diameter results, though we fixed a bug in that method by converting the bootstrapped uncertainties to the cumulative or relative form and then creating confidence intervals, rather than scaling those intervals from the differential form. All data have been normalized to the moon’s surface area except A. Silburt et al. (2019), which was divided by 0.2887, and C. Yang et al. (2020) by 0.9063. Both of those are not entirely comparable to the overall population because they did not include large portions of the moon; this is discussed in the text. Additionally, “La Grassa et al. (2025)” has two lines because both of their works were published in 2025; their second work has the higher values.
Other Images in This Article
Copyright and Terms & Conditions
© 2026. The Author(s). Published by the American Astronomical Society.

