Image Details
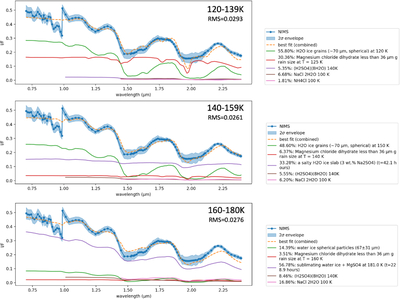
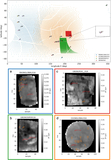
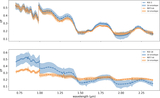
Caption: Figure 9.
Comparison of best-fit spectral models for ROI #10 across the three temperature ranges. Each panel shows the NIMS reflectance spectrum (blue points), 2σ uncertainty envelope (shaded), and the combined best-fit model (orange dashed line). The corresponding end-member contributions are indicated in the legend.
Other Images in This Article
Show More
Copyright and Terms & Conditions
© 2026 The Author(s). Published by the American Astronomical Society.
Copyright ©
2026 Astronomy Image Explorer. All Rights Reserved.