Image Details
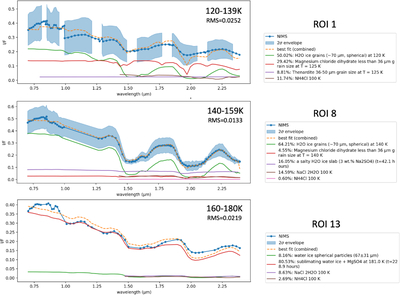
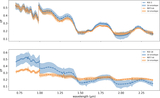
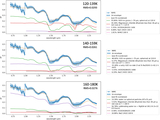
Caption: Figure 10.
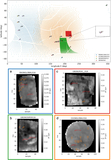
Representative best-fit spectra for ROIs #1, #8, and #13. Each plot shows the NIMS reflectance data (blue points) with 2σ uncertainty (shaded), the combined best-fit model (orange dashed line), and the individual end-member contributions. The 2σ envelope for ROI #13 is missing due to the lack of surrounding pixels since the pixels that include this region are on the edge of the NIMS cube.
Other Images in This Article
Show More
Copyright and Terms & Conditions
© 2026 The Author(s). Published by the American Astronomical Society.
Copyright ©
2026 Astronomy Image Explorer. All Rights Reserved.