Image Details
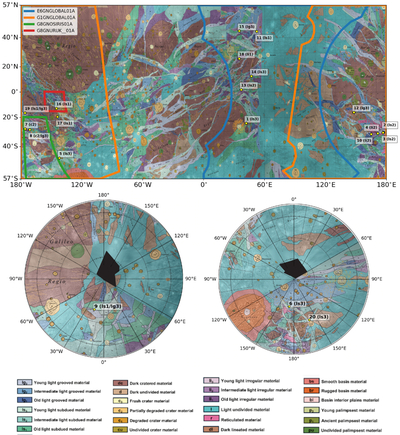
Caption: Figure 1.
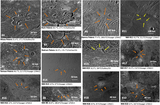
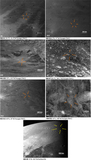
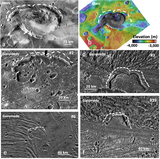
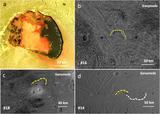
Locations (yellow circles) of ROIs that include paterae, potential flows, and cryovolcanic candidate regions (K. Stephan et al. 2021a) on top of the global geological map of Ganymede from G. C. Collins et al. (2013). (Top: Mercator projection; bottom left: orthogonal projection centered at the north pole; and bottom right: orthogonal projection centered at the south pole.) Each ROI label includes the geologic unit label as described in G. C. Collins et al. (2013). Examples include: light subdued (“ls”) materials; light grooved (“lg”) materials; light irregular (“li”) materials; and crater (“c”) materials. Colored outlines in the Mercator projection represent the areas covered by the four Near-Infrared Mapping Spectrometer (NIMS) cubes included in this study.
Other Images in This Article
Show More
Copyright and Terms & Conditions
© 2026 The Author(s). Published by the American Astronomical Society.