Image Details
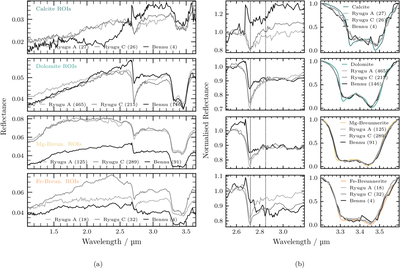
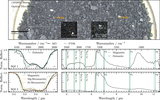
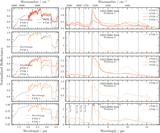
Caption: Figure 6.
Median spectra of carbonate ROIs in Ryugu (chambers A and C separately) and Bennu for four different carbonate compositions. The number in parentheses gives the number of averaged ROIs per spectrum. The left side shows the full spectra, the right side focuses on the 2.7 µm (normalized at 2.55 µm) and 3.4 µm (continuum-removed, scaled to uniform band depth) absorptions. Vertical dotted lines at 2.72 µm and 2.85 µm indicate typical band minima of Mg- and Fe-rich phyllosilicates, respectively.
Other Images in This Article
Copyright and Terms & Conditions
© 2026. The Author(s). Published by the American Astronomical Society.
Copyright ©
2026 Astronomy Image Explorer. All Rights Reserved.