Image Details
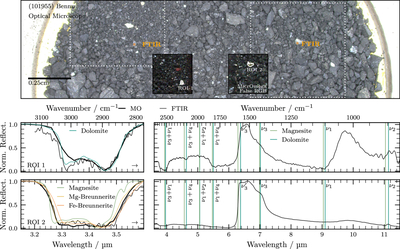
Caption: Figure 9.
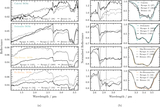
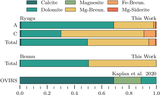
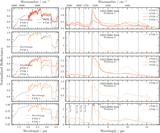
Identification of dolomite-like and breunnerite-like ROIs in bulk sample ORX-29000 of Bennu. Top: optical microscope image of the sample. White, dotted rectangles give the MicrOmega footprint, approximately 0.56 × 0.57 cm. Orange squares indicate the spots that were analyzed with the FTIR (spot size of 100 µm). The insets show false-RGB images of two MicrOmega measurements. The white contours labeled ROI 1 and ROI 2 show carbonate-rich areas that were automatically identified and characterized as dolomite-like and breunnerite-like respectively. Bottom: the MicrOmega (MO) and FTIR spectra of the two ROIs are shown for wavelengths below 3.6 µm in the left panel. For each ROI, we show the best-matching reference spectra (dolomite and Mg-breunnerite). For ROI 2, magnesite and Fe-breunnerite are further shown. For wavelengths above 3.6 µm (right panel), we depict the continuation of the FTIR spectra and reference vibrational modes of magnesite and dolomite from J. L. Bishop et al. (2021).
Other Images in This Article
Copyright and Terms & Conditions
© 2026. The Author(s). Published by the American Astronomical Society.