Image Details
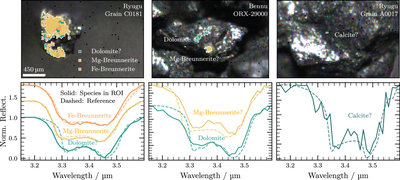
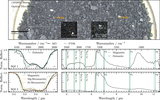
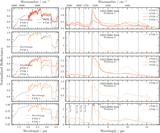
Caption: Figure 3.
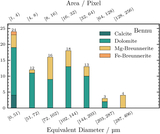
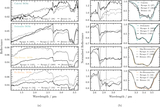
The top row shows false-RGB images of the samples acquired with MicrOmega. Carbonate-rich pixels are colored-in based on the most-likely carbonate composition for the respective pixel. Below the RGBs, we show the mean spectrum of all pixels associated with the dominant carbonate species in the measurement and the respective reference spectrum. The spectra are continuum-removed and vertically shifted for readability. The false-RGB channels represent the mean absorption around 2 µm, 3.4 µm, and 2.72 µm, respectively. The size scale is the same in all images.
Other Images in This Article
Copyright and Terms & Conditions
© 2026. The Author(s). Published by the American Astronomical Society.
Copyright ©
2026 Astronomy Image Explorer. All Rights Reserved.