

Image Details
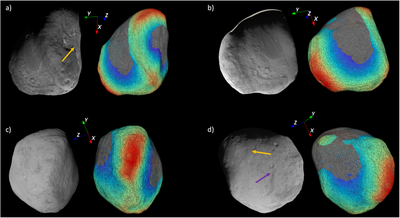
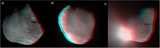
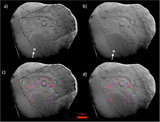
Caption: Figure 11.
Same as Figure 10, but with the shape model reoriented to match the viewing geometry of observed images for direct comparison (in all panels, the Z-axis indicates the north direction): panel (a) corresponds to the deconvolved 9000909 HRI image, where the orange arrow marks the location of the equatorial smooth unit; panels (b), (c), and (d) show NavCam images 30036, 30037, and 30039, respectively. In panel (d), the orange arrow points to the northern smooth unit, while the purple arrow indicates the terraces featuring up to five distinct steps. This simulation connects all the smooth units and the mass-wasting features on the opposite northern face as the outcome of a single event.
Other Images in This Article
Show More
Copyright and Terms & Conditions
© 2026. The Author(s). Published by the American Astronomical Society.

