

Image Details
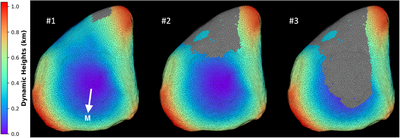
Caption: Figure 10.
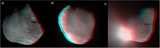
Simulation of flow evolution over the surface of 9P/Tempel 1. Panel (#1) shows the initial state, with the seed region placed between 160° and 180° W in longitude and −30° and +20° in latitude. Panel (#2) corresponds to an intermediate stage of the simulation, while (#3) displays the final outcome. The blue-to-red color scale on the facets indicates the gravitational potential, expressed in terms of dynamic heights. Gray facets represent the simulated flow region. To optimize computation time, the shape model was downsampled by a factor of 100, resulting in a mesh of 31,456 facets. A latitude–longitude grid, displayed from the same viewing perspective, is provided in Figure 2 for geographic orientation (the white arrow indicates the meridian). See Figure A5 for the corresponding animation of this simulation.
Other Images in This Article
Show More
Copyright and Terms & Conditions
© 2026. The Author(s). Published by the American Astronomical Society.

