

Image Details
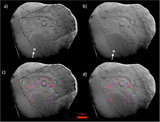
Caption: Figure 5.
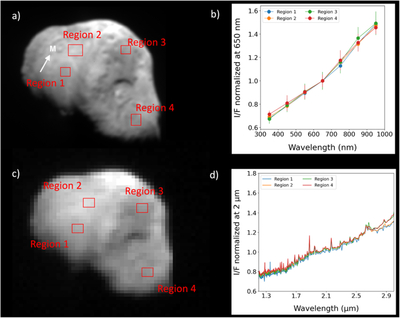
Visible and infrared observations of comet 9P/Tempel 1 from four selected regions (red squares). Panel (a) shows the HRI visible image used to extract spectra from the marked areas, with the corresponding reflectance spectra obtained in panel (b). Panel (c) presents a reconstructed infrared image with the same regions indicated, and panel (d) shows their corresponding IR spectra. Region 1 corresponds to the large smooth patch in both images. No significant spectral variability is observed among the selected regions. The white arrow indicates the meridian (see Figure 2 for reference).
Other Images in This Article
Show More
Copyright and Terms & Conditions
© 2026. The Author(s). Published by the American Astronomical Society.

Copyright ©
2026 Astronomy Image Explorer. All Rights Reserved.
