Image Details
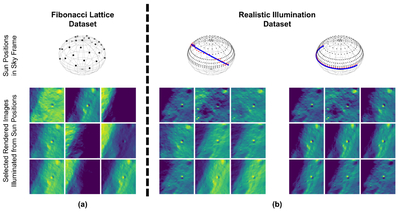
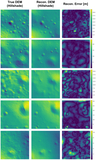
Caption: Figure 3.
In panel (a), illumination directions are defined using a Fibonacci lattice across the sky to represent the entire spectrum of illumination conditions. More realistic illumination (panel (b)) is considered by randomly determining a location of the DEM patch on the lunar surface, corresponding to an arc of possible illumination directions. Rendered images with illumination directions near this arc are chosen as “realistic.” In both sets of columns in panel (b), the assumed longitude of the patch is 0°E. The left set of columns assumes the latitude is 40°N, while the right set of columns assumes 88°N.
Other Images in This Article
Show More
Copyright and Terms & Conditions
© 2026. The Author(s). Published by the American Astronomical Society.