Image Details
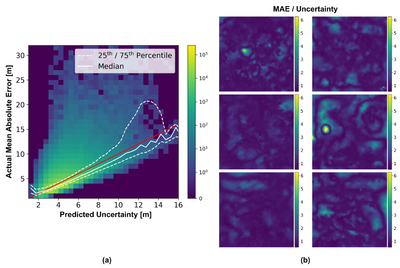
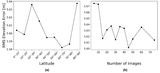
Caption: Figure 9.
In panel (a), the correlation between prediction uncertainty and MAE is visualized, with 1:1 line shown in red and quantiles of the column marginals shown as white lines. In panel (b), the ratio between the MAE and the prediction uncertainty is shown for six different test dataset patches. We find that the predicted uncertainty is typically within a factor of ∼2 of the true elevation MAE.
Other Images in This Article
Show More
Copyright and Terms & Conditions
© 2026. The Author(s). Published by the American Astronomical Society.
Copyright ©
2026 Astronomy Image Explorer. All Rights Reserved.