

Image Details
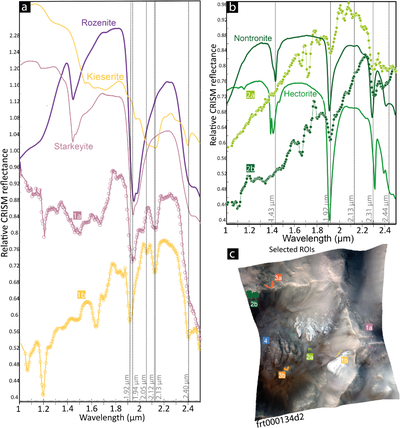
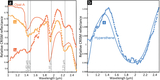
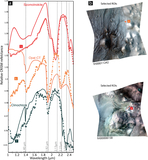
Caption: Figure 5.
Spectral signatures of mineral units in CRISM image FRT000134D2. (a) Relative CRISM I/F spectra of sulfate-bearing units 1(a) and 1(b) compared with laboratory spectra of polyhydrated sulfates: rozenite (BKR1JB1858c, violet; Bishop et al. 2025), starkeyite (BKR1JB0711, pink; Bishop et al. 2009), and kieserite (BKR1JB1761B, yellow; Bishop et al. 2025). (b) Relative CRISM I/F spectrum of phyllosilicate-bearing units 2(a) and 2(b) compared with laboratory spectra of hectorite (BKR1JB0172, green; Bishop et al. 2008a) and nontronite from Sampor (BKR1JB0175, blue; Bishop et al. 2002). Dashed lines indicate diagnostic absorption bands. (c) Locations of ROIs for mineral units whose corresponding spectra are shown in panels (a) and (b) of this figure and in Figure 6.
Other Images in This Article
Copyright and Terms & Conditions
© 2026. The Author(s). Published by the American Astronomical Society.

