

Image Details
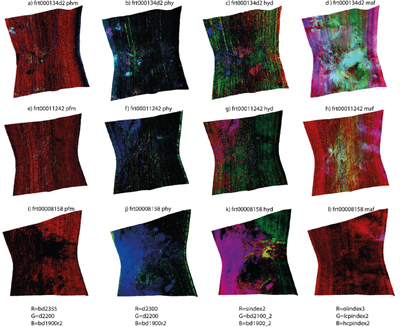
Caption: Figure A1.
Views of CRISM images parameter maps illustrating different mineral units. Columns represent different RGB band combinations while rows represent the three investigated areas (FRT000134D2, FRT00011242, and FRT00008158). In the first column (panels a, e, and i) blue and light blue colors highlight Al-phyllosilicates;green colors highlight poorly crystalline aluminosilicates (PFM index). In the second column (panels b, f, and j) red and magenta colors highlight phyllosilicates and Fe/Mg–OH-bearing minerals; green or cyan colors highlight hydrated Al/Si–OH-bearing minerals (HYD index). In the third column (panels c, g, and k) magenta colors highlight polyhydrated sulfates, while blue colors highlight other hydrated phases; yellow colors highlight monohydrated sulfates (MHS index). Finally, the last column on the right (panels d, h, and l) represents mafic mineralogy where cyan indicates low-calcium pyroxenes and magenta indicates high-calcium pyroxenes (MAF index).
Other Images in This Article
Copyright and Terms & Conditions
© 2026. The Author(s). Published by the American Astronomical Society.

