

Image Details
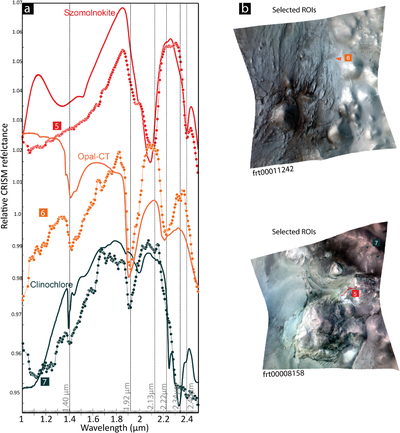
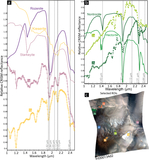
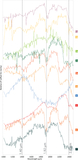
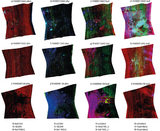
Caption: Figure 7.
Spectral signatures of mineral units 5–7 in CRISM images FRT00008158 and FRT00011242. (a) Relative CRISM I/F spectra compared with laboratory spectra from the Bishop spectral library: clinochlore (BKR1Jb738; Bishop et al. 2008a), szomolnokite (BKR1JB1855; Bishop et al. 2025), and opal-CT (BKR1JB874; McKeown et al. 2011). Dotted curves indicate CRISM spectra, solid lines laboratory spectra; vertical dotted lines mark diagnostic absorption features. (b) False-color images showing the locations of the ROIs for units 5, 6 and 7 in FRT00011242 and FRT00008158.
Other Images in This Article
Copyright and Terms & Conditions
© 2026. The Author(s). Published by the American Astronomical Society.

Copyright ©
2026 Astronomy Image Explorer. All Rights Reserved.
