Image Details
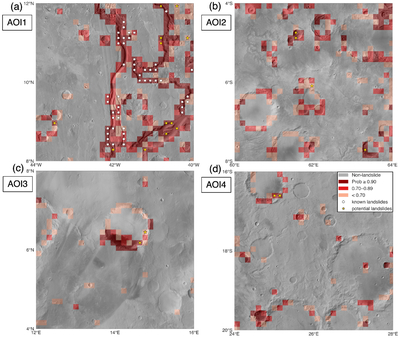
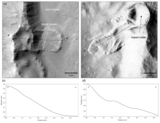
Caption: Figure 6.
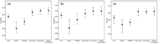
Predictions on four independent AOIs are shown. White dots represent known landslides previously mapped by G. B. Crosta et al. (2018b), and yellow stars denote new landslides. All tiles are color-coded according to their predicted probability: high-confidence detections (p ≥ 0.90) are shown in dark red, moderate-confidence detections (0.70 ≤ p < 0.90) in medium red, and low-confidence detections (p < 0.70) in light red.
Other Images in This Article
Copyright and Terms & Conditions
© 2026. The Author(s). Published by the American Astronomical Society.
Copyright ©
2026 Astronomy Image Explorer. All Rights Reserved.