Image Details
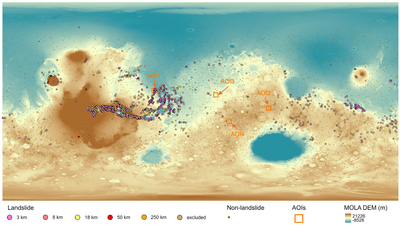
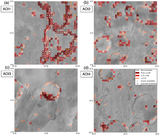
Caption: Figure 1.
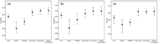
Map showing the distribution of landslide features and randomly clipped nonlandslide features, which serve as the input dataset for the Mars-DiSVM framework. Orange polygons represent the areas of interest (AOIs), including an area with mapped landslides from the inventory of G. B. Crosta et al. (2018b) as well as areas without mapped landslides.
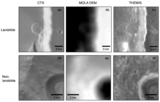
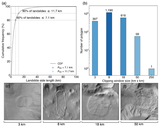
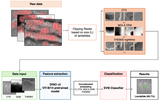
Other Images in This Article
Copyright and Terms & Conditions
© 2026. The Author(s). Published by the American Astronomical Society.
Copyright ©
2026 Astronomy Image Explorer. All Rights Reserved.