Image Details
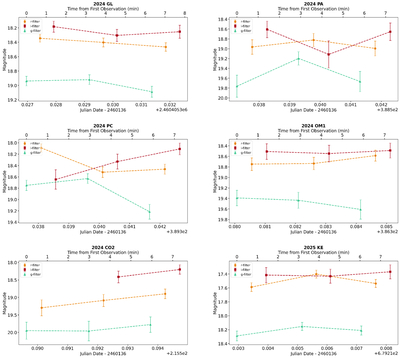
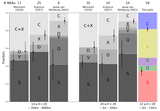
Caption: Figure 2.
Examples of the photometry data for several NEAs observed during this program, showing their variation in magnitude over time in three different filters: g filter (green), r filter (orange), and i filter (red). The observations were taken in a repeating sequence of clear, g, r, and i filters. The clear-filter data are not shown in these plots, only used for astrometric data submitted to the MPC and not for any analysis presented in this study.
Other Images in This Article
Copyright and Terms & Conditions
© 2026. The Author(s). Published by the American Astronomical Society.
Copyright ©
2026 Astronomy Image Explorer. All Rights Reserved.