Image Details
Caption: Figure 1.
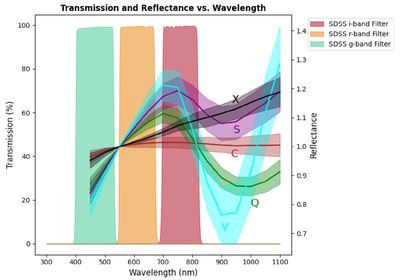
The transmission profiles of the SDSS g- (green), r- (orange), and i-band (red) filters alongside the average reflectance spectra from the Bus−DeMeo taxonomic scheme asteroid taxonomic classes: S- (purple), C- (red), X- (black), Q- (green), and V-type (cyan). The reflectance uncertainty bands for each taxonomic class are also displayed as shaded regions. The plot shows the good spectral range overlap between the g, r, and i filters, where the spectral slope of the different asteroid types varies. Therefore, determining g − r and r − i colors can measure the spectral slope, allowing differentiation between the taxonomic classes.
Other Images in This Article
Copyright and Terms & Conditions
© 2026. The Author(s). Published by the American Astronomical Society.