Image Details
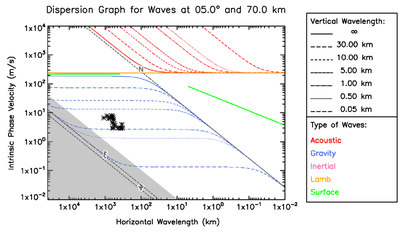
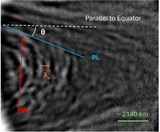
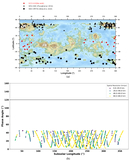
Caption: Figure 18.
Dispersion diagram for dynamically characterized waves with Akatsuki/UVI. Each dashed colored line represents the value of the vertical wavelength that a wave would have given its specific horizontal wavelength and intrinsic phase velocity values according to the models described in J. Peralta et al. (2014).
Other Images in This Article
Show More
Copyright and Terms & Conditions
© 2026. The Author(s). Published by the American Astronomical Society.
Copyright ©
2026 Astronomy Image Explorer. All Rights Reserved.