Image Details
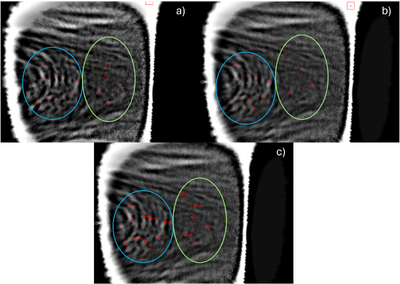
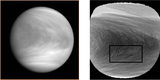
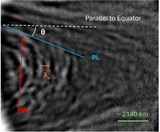
Caption: Figure 8.
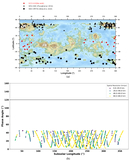
Example of tracer analysis applied to a pair of consecutive images from orbit r0095. Panels (a) and (b) show the distribution of individual tracers, and panel (c) illustrates the corresponding motion vectors indicated by red arrows drawn on the same image as panel (b). The tracers and vectors inside the blue ellipse represent the wave phase speed, while those inside the green ellipse represent the background wind speed.
Other Images in This Article
Show More
Copyright and Terms & Conditions
© 2026. The Author(s). Published by the American Astronomical Society.
Copyright ©
2026 Astronomy Image Explorer. All Rights Reserved.