Image Details
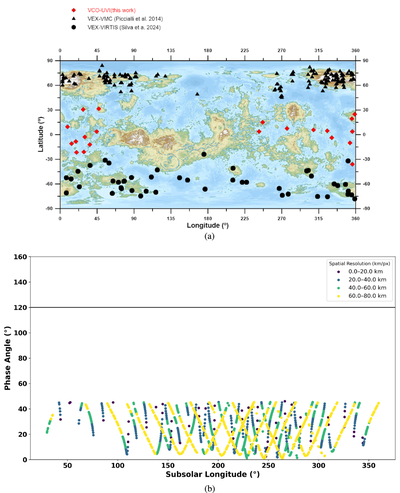
Caption: Figure 9.
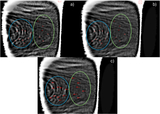
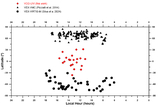
(a) Distribution of characterized wave packets on the dayside of Venus during the period of observation vs. latitude and longitude. Red diamonds represent this work’s Akatsuki/UVI wave packets, black triangles represent the A. Piccialli et al. (2014) wave packets, and black circles represent the J. E. Silva et al. (2024) wave packets. (b) Phase angle of all Akatsuki/UVI images acquired with the 365 nm filter that satisfy the condition ∣LonSS − LonSSC∣ < 45°, where LonSS is the subsolar longitude and LonSSC is the subspacecraft (subobserver) longitude. Each circle corresponds to one image, and the horizontal line at 120° indicates the same cutoff limit used in Figure 1. Colors denote the spatial resolution of each image.
Other Images in This Article
Show More
Copyright and Terms & Conditions
© 2026. The Author(s). Published by the American Astronomical Society.