Image Details
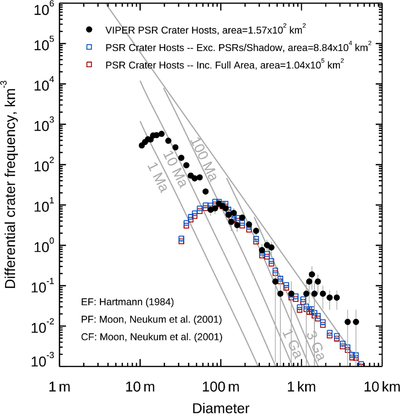
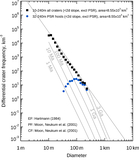
Caption: Figure 5.
A differential SFD of PSRs within the VIPER landing areas based on SfS topography, along with the background population across the pole. On this differential plot, where the PSR-hosting craters’ SFD crosses isochrons is a proxy for how long craters at that size typically host PSRs. The continued upward slope of craters found to host PSRs from D ∼ 20 to 80 m contrasts with the pole-wide analysis, suggesting that the PSR-hosting lifetime declines more steadily than would be inferred from the pole-wide analysis alone. The most likely cause of this is incomplete detection of decameter-scale PSRs with LOLA data alone. For this reason, we use the VIPER region as a guide to the lifetimes of craters D < 100 m. Plotted with CraterStats (G. G. Michael 2013).
Other Images in This Article
Copyright and Terms & Conditions
© 2026. The Author(s). Published by the American Astronomical Society.