Image Details
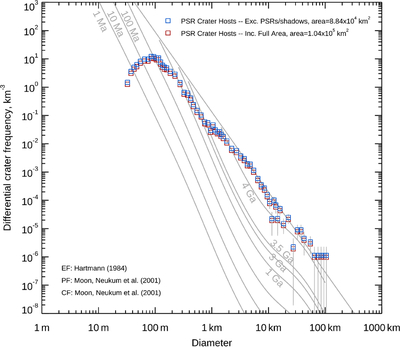
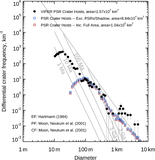
Caption: Figure 3.
A differential SFD of craters that host PSRs (binned in ﹩\sqrt[4]{2}﹩ bins from 32 m to 131 km). On this differential plot, where the PSR-hosting craters’ SFD crosses isochrons is a proxy for how long craters at that size typically host PSRs. The two overlapping series on this plot come from how counts were converted to frequency. The red series is based on assuming that the effective count area is the full area south of 84°S (equivalent to assuming that any new crater will host a PSR; a good assumption for large craters). The blue series is the frequency based on an area excluding PSR area (because small new craters that form inside existing PSRs will not themselves host a PSR but instead fall inside one), also excluding areas not illuminated on the LROC-controlled mosaic. The uncertainty in frequency this fuzziness in area induces is a ∼15% effect. The rollover in PSR-hosting craters at sizes smaller than 80 m is likely set by the minimum size of PSRs resolved in the LOLA PSR catalog (see Figure 5). Plot made using CraterStats (G. G. Michael 2013).
Other Images in This Article
Copyright and Terms & Conditions
© 2026. The Author(s). Published by the American Astronomical Society.