Image Details
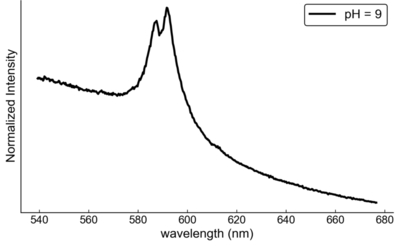
Caption: Figure 4.
Example of an LIBS spectrum showing Na atomic emission lines, obtained for a sample from the pH 9 solution. The spectrum was acquired using the same instrumental setup as that used in this study (accumulation count = 100, grating = 150 lines mm−1, exposure time = 10 ns), but with a smaller laser spot diameter (∼2 mm).
Other Images in This Article
Copyright and Terms & Conditions
© 2026. The Author(s). Published by the American Astronomical Society.
Copyright ©
2026 Astronomy Image Explorer. All Rights Reserved.