Image Details
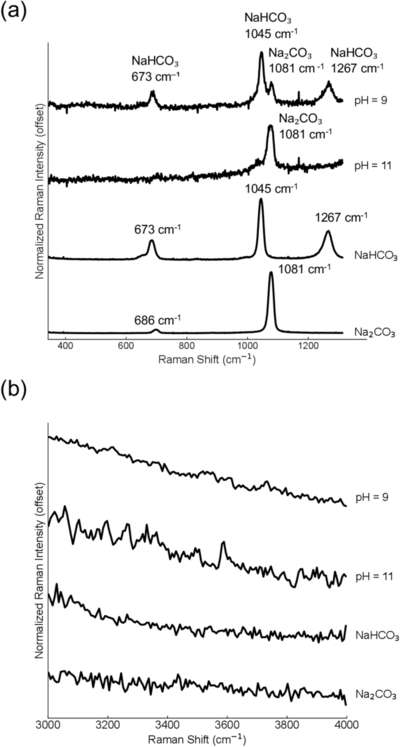
Caption: Figure 3.
Raman spectra of samples under different pH conditions. Each spectrum represents the average of 1000 laser pulses. Measured spectra of standard NaHCO3 and Na2CO3 powders are shown at the bottom of both panels for reference. (a) Spectra in the 400–1300 cm−1 range. Raman peaks observed at approximately 673, 1045, and 1267 cm−1 are assigned to vibrational modes of the bicarbonate ion (HCO﹩{}_{3}^{-}﹩). Raman peaks observed at approximately 686 and 1081 cm−1 are assigned to vibrational modes of the carbonate ion (CO﹩{}_{3}^{2-}﹩). (b) Spectra in the 3200–4000 cm−1 range.
Other Images in This Article
Copyright and Terms & Conditions
© 2026. The Author(s). Published by the American Astronomical Society.
Copyright ©
2026 Astronomy Image Explorer. All Rights Reserved.