Image Details
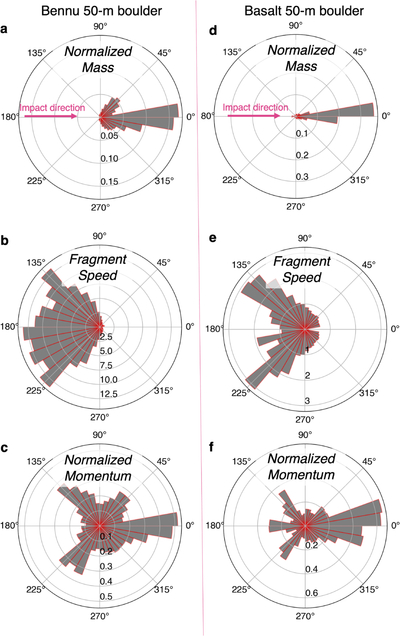
Caption: Figure 16.
Rose diagrams showing the distribution of ejection angles for impact fragments relative to the velocity vector of the impactor (0°) for simulations of impacts disrupting a 50 m diameter Bennu boulder (left column) and a 50 m diameter basalt boulder (right column). (a) The distribution of mass, normalized by the total mass of the target, traveling along each ejection angle (binned at increments of 5°). (b) Same as panel (a), but for the speed of ejecta fragments in meters per second. (c) Same as panel (a), but for the momentum of fragments normalized by the impactor’s momentum. (d–f) Same as panels (a)–(c), but for the basalt target.
Other Images in This Article
Show More
Copyright and Terms & Conditions
© 2026. The Author(s). Published by the American Astronomical Society.