Image Details
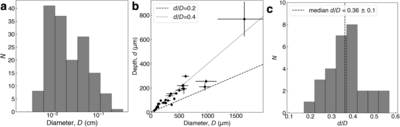
Caption: Figure 6.
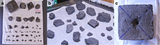
Depth, d, and diameter, D, of the craters on centimeter-scale Bennu samples. (a) Histogram showing the distribution of all 143 craters mapped on Bennu samples in this study. (b) The d of a subset of 40 of the largest craters as a function of their D, showing how the population clusters around d/D = 0.4 (dotted black line), with a minority reaching values as small as d/D = 0.2 (dashed black line). (c) A histogram of the crater d/D values from panel (b), which have a median of 0.36 ± 0.1. The values are not normally distributed, and there are some outlier craters with deep d/D.
Other Images in This Article
Show More
Copyright and Terms & Conditions
© 2026. The Author(s). Published by the American Astronomical Society.
Copyright ©
2026 Astronomy Image Explorer. All Rights Reserved.