Image Details
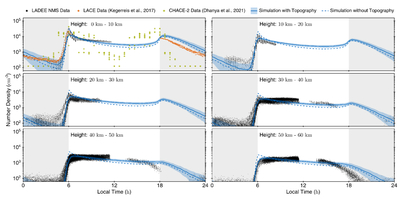
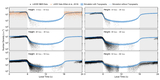
Caption: Figure 9.
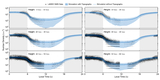
Comparison of the 40Ar number densities with data from LADEE’s NMS, Apollo’s LACE instrument (J. A. Kegerreis et al. 2017), and surface-projected CHACE-2 data (M. B. Dhanya et al. 2021), separated into the first six 10 km layers based on the simulation’s discretization. The blue band around the simulation results represents one standard deviation of uncertainty, based on the variance within the MC steps. For comparison, the results of a simulation without topography have been added as blue dashed lines. The shaded gray area marks the lunar nightside.
Other Images in This Article
Copyright and Terms & Conditions
© 2026. The Author(s). Published by the American Astronomical Society.
Copyright ©
2026 Astronomy Image Explorer. All Rights Reserved.