Image Details
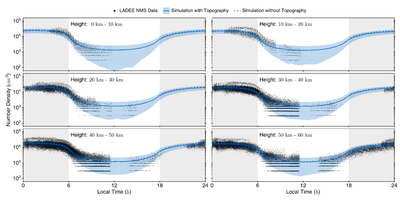
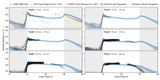
Caption: Figure 7.
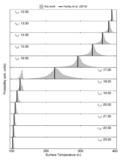
Comparison of helium number densities from LADEE NMS measurements (black dots) and simulation results (blue line) in six altitude bins of 10 km each. The shaded blue region indicates one standard deviation of variability from the MC simulation. For comparison, the results of a simulation without topography have been added as blue dashed lines. The shaded gray area marks the lunar nightside.
Other Images in This Article
Copyright and Terms & Conditions
© 2026. The Author(s). Published by the American Astronomical Society.
Copyright ©
2026 Astronomy Image Explorer. All Rights Reserved.