Image Details
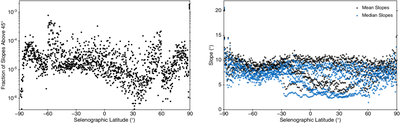
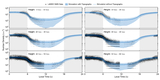
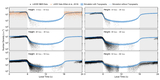
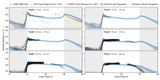
Caption: Figure 11.
Statistical characterization of the probabilistic slope model. Left: fraction of slopes exceeding 45° as a function of selenographic latitude, demonstrating that such slopes are extremely rare, with most values below 1 × 10⁻⁴ globally. Right: mean and median slopes per latitude band, showing consistent behavior across the surface and confirming that the model is dominated by moderate slopes well below the cutoff.
Other Images in This Article
Copyright and Terms & Conditions
© 2026. The Author(s). Published by the American Astronomical Society.
Copyright ©
2026 Astronomy Image Explorer. All Rights Reserved.