Image Details
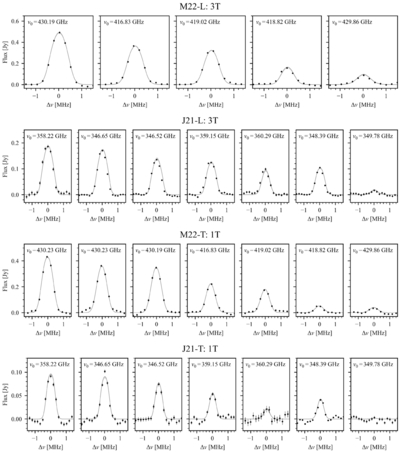
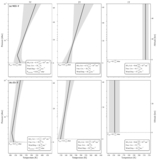
Caption: Figure 9.
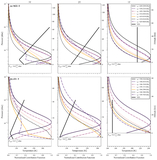
Observed and modeled SO2 rotational line spectra for all datasets. Each row corresponds to a specific dataset and TP parameterization, as labeled (M22-L: 3T; J21-L: 3T; M22-T: 1T; and J21-T: 1T). Individual panels show the targeted SO2 transitions, which are labeled by their rest frequency ν0 and centered in frequency space. Observed spectra are plotted as black points. The best-fit model is overlaid as a dark-gray line, with the lighter shading indicating the 1σ uncertainty.
Other Images in This Article
Copyright and Terms & Conditions
© 2026. The Author(s). Published by the American Astronomical Society.
Copyright ©
2026 Astronomy Image Explorer. All Rights Reserved.