Image Details
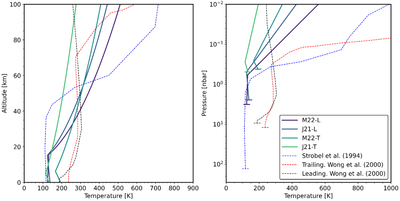
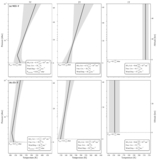
Caption: Figure 5.
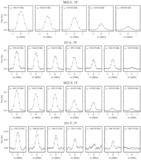
Retrieved temperature–altitude profiles for Io from our four ALMA datasets (M22-L, J21-L, M22-T, and J21-T), each fit with the same 3T temperature parameterization (solid lines). The left panel shows the retrieved TPs as a function of altitude (km), while the right panel shows the same profiles as a function of pressure (nbar). The horizontal bars in the right panel mark the surface pressure associated with each model. For context, dashed curves show representative model profiles from D. F. Strobel et al. (1994) and M. C. Wong & W. H. Smyth (2000). Specifically for D. F. Strobel et al. (1994), we plot the high-density dayside solutions from their model that includes solar, plasma, and Joule heating. For M. C. Wong & W. H. Smyth (2000), we plot the high-density dayside solutions at western elongation (trailing hemisphere) and eastern elongation (leading hemisphere).
Other Images in This Article
Copyright and Terms & Conditions
© 2026. The Author(s). Published by the American Astronomical Society.