Image Details
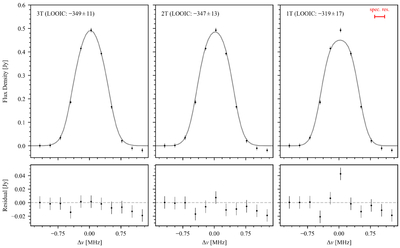
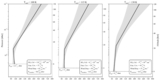
Caption: Figure 2.
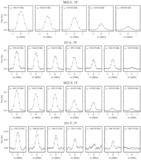
Model comparison for the SO2 transition at 430.194 GHz from M22-L. The observed spectrum (black points with error bars) is overlaid with best-fit model spectra for the three tested TPs: 3T (left), 2T (middle), and 1T (right). The red bar in the upper right corner of the right column indicates the ALMA spectral resolution (FWHM). Residuals are shown in the bottom row.
Other Images in This Article
Copyright and Terms & Conditions
© 2026. The Author(s). Published by the American Astronomical Society.
Copyright ©
2026 Astronomy Image Explorer. All Rights Reserved.