Image Details
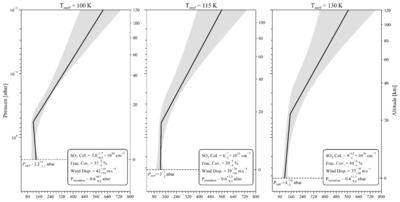
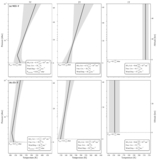
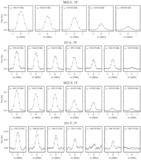
Caption: Figure 6.
Effect of fixed surface temperature on retrieved atmospheric structure. The three columns correspond to retrievals from the M22-L dataset performed with fixed surface temperatures of 100 K (left), 115 K (middle), and 130 K (right), each assuming an emissivity of 0.8. The panels show the retrieved 3T TPs as a function of pressure. The black curve is the best-fit TP; the gray band marks the 1σ credible interval. The legend for each profile provides the best-fit SO2 column density, fractional coverage, wind dispersion, and transition pressure (with 1σ errors). Left axes give pressure; right axes show the corresponding altitude. The dashed horizontal black line indicates the modeled surface pressure, quoted with uncertainties calculated from the upper and lower bounds of the SO2 column density.
Other Images in This Article
Copyright and Terms & Conditions
© 2026. The Author(s). Published by the American Astronomical Society.