

Image Details
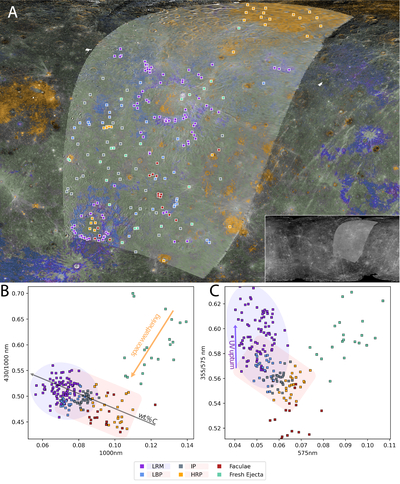
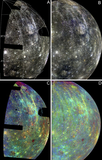
Caption: Figure 12.
Color mosaic sample location map (−40°–80°N, 157°–320°E) and derived ratio-reflectance plots. (A) 4 km px−1 simple cylindrical projection of MDIS 430/1000 nm ratio image (basemap), Mariner 10 UV/OR outgoing ratio image, and color unit mask layer delimiting LRM, LBPs, IPs, and HRPs. Colors for each unit correspond to their legend markers (bottom of figure), except for IPs, which were given a green tint to differentiate them from unclassified terrain (gray in the ratio images). Boxes represent sample locations and are centered over the measured pixels (average of 3 × 3 pixels, box not to scale). The Mariner 10 UV/OR ratio image is stretched in this figure to provide contrast with the MDIS basemap. Inset: simple cylindrical projection of the ratio images for context (0–360°E longitude domain). Ratio-reflectance plots of the sampled locations in (B) MDIS 430/1000 nm and (C) Mariner 10 UV/OR. LRM measurements in (B) and (C) are delimited by the elliptical violet shaded region, other major color units (LBPs, IPs, HRPs) in the rectangular red-orange shaded region (both correspond to the text highlight colors of their respective legend entries). Trends of increasing carbon content, exposure to space weathering, and evidence of UV upturn are delineated according to Figure 10.
Other Images in This Article
Show More
Copyright and Terms & Conditions
© 2026. The Author(s). Published by the American Astronomical Society.

