

Image Details
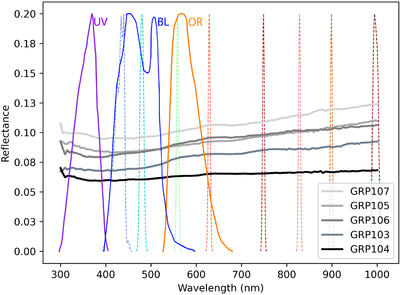
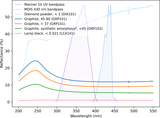
Caption: Figure 6.
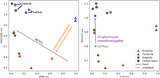
Sensitivity of Mariner 10 and MDIS filters compared to graphite reflectance. Spectra show the laboratory reflectance at i = 30°, e = 0°, g = 30° of five natural graphite samples, with particle sizes <45 ﹩﹩m, and one synthetic carbon black sample (LCA101; i = 0°, e = 15°, g = 15°; particle size <0.021 ﹩\mu ﹩m) obtained from the Mineral and Rock Sample Database, Planetary Spectrophotometer Lab, University of Winnipeg (E. Cloutis et al. 2006). The increase in graphite reflectance toward UV wavelengths corresponds to the edge of a strong sp2 ﹩\pi ﹩– ﹩\pi ﹩* reflectance peak. Dashed line peaks are the normalized filter transmissivity curves for the MDIS bands included in the eight-color mosaic; solid line peaks are the normalized integrated optic, filter, and sensor response curves for the Mariner 10 observations.
Other Images in This Article
Show More
Copyright and Terms & Conditions
© 2026. The Author(s). Published by the American Astronomical Society.

