

Image Details
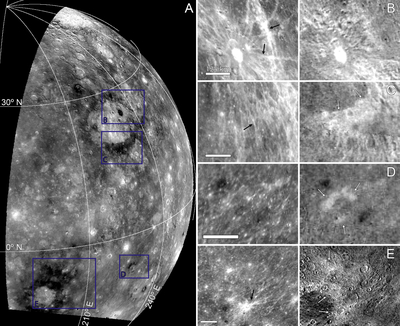
Caption: Figure 11.
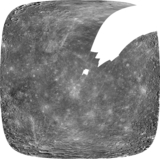
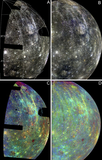
Comparison of LRM deposits in MDIS 430/1000 nm vs. Mariner 10 UV/OR. (A) MDIS PC2 image for context, cropped and projected to match the bounds of the Mariner 10 UV/OR mosaic. Variations are interpreted as being due to composition rather than maturity state or illumination (M. S. Robinson et al. 2008). Blue boxes highlight LRM deposits. (B)–(E) blue-boxed areas of (A) as seen in MDIS 430/1000 nm (left tiles) and Mariner 10 UV/OR (right tiles). Bright areas in the MDIS ratio are dominated by fresh crater ejecta and rays (black arrows). Most crater rays fade to the background in the Mariner 10 ratio, while LRM deposits appear bright (white arrows). Images are 4 km px−1. Scale bars are 125 km.
Other Images in This Article
Show More
Copyright and Terms & Conditions
© 2026. The Author(s). Published by the American Astronomical Society.

