Image Details
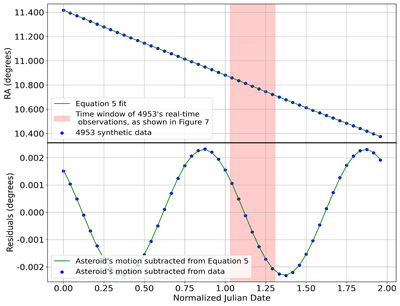
Caption: Figure 2.
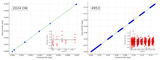
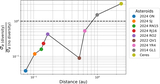
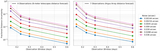
Similar to Figure 1. (Top panel) We obtain synthetic data for 4953 from Horizons. The blue dots indicate the R.A. observations from 2024 October 30–31, at every hour, totaling 48 observations. We fit Equation (5) to the data as shown by the green line. (Bottom panel) The residuals after subtracting out the asteroids' motion from Equation (5) are shown by the green line and from the data are shown by blue dots. The highlighted red region in both rows represents the real-time observation of 4953 as seen in Figure 7.
Other Images in This Article
Copyright and Terms & Conditions
© 2026. The Author(s). Published by the American Astronomical Society.
Copyright ©
2026 Astronomy Image Explorer. All Rights Reserved.