Image Details
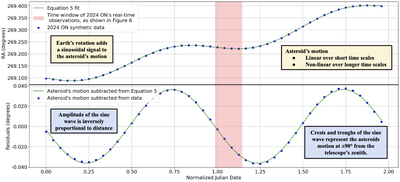
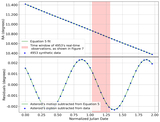
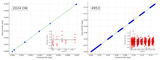
Caption: Figure 1.
We obtain synthetic data for asteroid 2024 ON from Horizons. The ephemerides are generated by numerically integrating the orbits of celestial objects to their real-time observations (W. M. Folkner et al. 2014). (Top panel) The raw R.A. positions as a function of time, where the dots indicate the 48 observations taken from 2024 September 5–6 at every hour. The first-order behavior is due to the asteroid’s motion. The smaller sinusoidal behavior is due to the rotation of the Earth. (Bottom panel) The remaining sinusoidal behavior after subtracting out a second-order polynomial fit is shown in blue dots. The period of the sine curve due to the rotation of the Earth is 1 day and indicated by the green line. The amplitude of the sine curve is used in Equation (3) to measure the distance to the asteroid as seen in Equation (4). The amplitude changes with time as the distance to the asteroid changes with time. The highlighted red region in both rows represents the real-time observations of 2024 ON, as discussed in Section 3 and seen in Figure 6.
Other Images in This Article
Copyright and Terms & Conditions
© 2026. The Author(s). Published by the American Astronomical Society.