Image Details
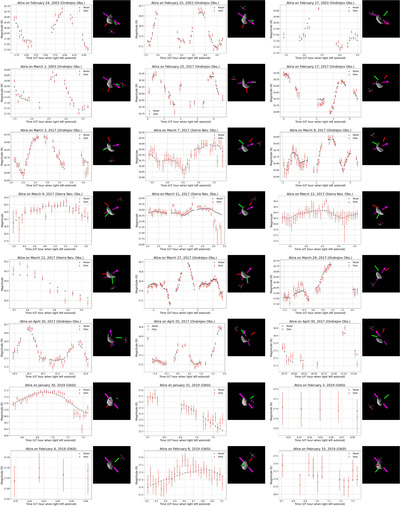
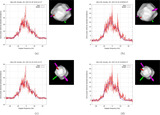
Caption: Figure 14.
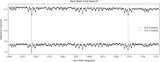
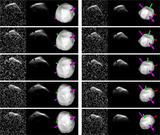
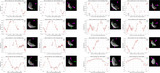
Observed lightcurves (red) and model lightcurves (black) of model 1. The observatory is indicated in parentheses in the individual lightcurve titles. For each panel, the shape model on the right is the simulated plane-of-sky image of the binary system as observed during the middle of the observation. Note that lightcurves from different dates have different amplitudes, so these different frames are plotted with different ranges along their y-axes.
Other Images in This Article
Show More
Copyright and Terms & Conditions
© 2024. The Author(s). Published by the American Astronomical Society.
Copyright ©
2025 Astronomy Image Explorer. All Rights Reserved.