Image Details
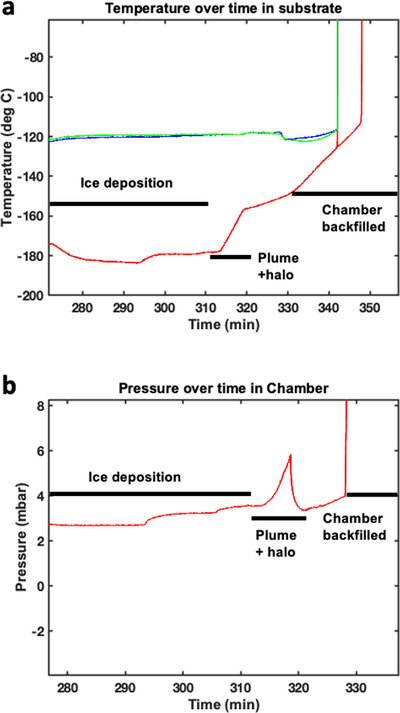
Caption: Figure 11.
Plots from an experimental example where the heater was run at full power and the plume was allowed to continue, indicating how the thermocouple closest to the plume at the surface rose in temperature and the pressure spiked slightly. Panel (a) shows temperature from three thermocouples before, during, and after plume activity and subsequent end of experiment where chilling was concluded. Red indicates the lowest thermocouple. Blue and green indicate the thermocouples placed close to the heater just below the surface. Panel (b) shows pressure measurement before, during, and after plume activity and subsequent end of experiment backfilling of the chamber with nitrogen gas. Axes are not aligned owing to zooming in at different scales for pressure and temperature.
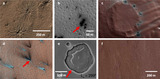
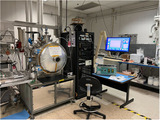
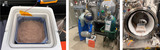
Other Images in This Article
Copyright and Terms & Conditions
© 2024. The Author(s). Published by the American Astronomical Society.