Image Details
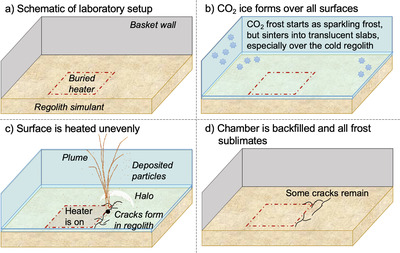
Caption: Figure 4.
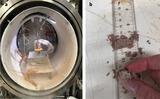
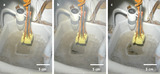
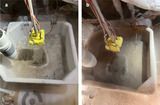
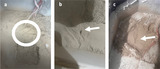
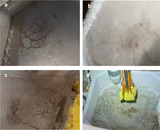
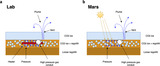
Schematic indicating each stage of the Kieffer model shown in Figure 2, replicated in our experiments. Panel (a) shows our lab setup. Panel (b) shows Stage 1: CO2 ice condensation. Panel (c) shows plume and spot formation and the formation of spider-like morphologies. Panel (d) shows the remaining morphologies. An animation of this process is available. This real-time animation after plume activity begins shows vigorous plume dynamics with dark ejecta emanating from the surface of our sample and eventual cracking of the surface. The duration of the animation is 9 minutes and 5 s. All animations show recordings taken with a webcam from an upper viewport on the chamber.
(An animation of this figure is available in the online article.)
(An animation of this figure is available.)
The video/animation of this figure is available in the online journal.
Other Images in This Article
Copyright and Terms & Conditions
© 2024. The Author(s). Published by the American Astronomical Society.